The practical question
A product can sell more because more people want it, because more stores stock it or because the price was cut. FMCG marketing metrics need to separate those explanations. A single sales-growth percentage cannot show whether advertising, availability or promotion did the work. This guide connects household penetration, distribution, rate of sale and repeat buying. It also explains why a brand team should read retailer and shopper evidence together before deciding that a campaign has strengthened the brand.
Start with the market you are actually measuring
Define the category, geography, channel and observation period. A modern-trade panel, general-trade audit and ecommerce dataset may each cover different parts of the market. Do not add them casually if their populations or methods overlap. Household penetration means the share of the defined household population that bought the brand during a specified period. Its interpretation depends on category frequency: an annual measure for a seasonal product answers a different question from a monthly measure for a frequently bought staple. Use a stable category definition and explain coverage gaps. A movement in measured sales is useful evidence, but it may not describe unmeasured stores or channels.
Read velocity on a stated distribution basis
Rate of sale can be expressed as units per selling store per week, while syndicated velocity measures may use sales per distribution point. NielsenIQ defines velocity as sales per distribution point.3 Those denominators are not interchangeable. If a brand expands into many weaker stores, its average units per store can decline while total sales grow. That does not automatically mean demand weakened in the original stores. Examine comparable-store sales, store mix and promotional intensity. Include realised price and availability. FMCG marketing metrics become more useful when the report explains why the rate moved, instead of displaying a red arrow beside a number whose denominator changed during the quarter. Our guide to physical availability covers the next question. If that is your next question, read our guide to brand equity models.
A fictional launch separates availability from demand
Imagine a fictional beverage SKU is sold in 200 stores for eight weeks. It sells 32,000 units, averaging twenty units per selling store per week under a simple constant-store assumption. In the next eight weeks, availability doubles to 400 stores and total sales reach 48,000 units. Average rate becomes fifteen units per store per week. The team should not immediately declare the launch weaker: newer stores may still be establishing shelf presence, and store quality may differ. Compare the original 200 stores and check price, promotions and stockouts. These figures illustrate one denominator; they are not NielsenIQ estimates, a Quiamo result or a recommended category target. FMCG marketing metrics should keep availability and demand in separate rows. Customer lifetime value is explained in a separate guide.
Measure buying behaviour with the product cycle in mind
Penetration, purchase frequency and volume per buying household describe different parts of sales. Repeat purchase needs a defined first-purchase cohort and enough time for another plausible purchase. A household that bought a large pack may not return within the same window as one that bought a single serving. A trial promotion can lift penetration without establishing sustained buying. Follow the cohort through later buying opportunities and compare contribution after the promotion ends. Brand awareness can support the interpretation, but it is not a substitute for behavioural evidence. Track whether the brand is associated with relevant occasions so the team can investigate where memory and availability reinforce each other. For the wider picture, see our guide to marketing mix modelling.
Separate demand from availability
Bring the category definition, distribution basis and a comparable sales period. Quiamo can help turn the growth question into a shopper communication brief without confusing wider availability with stronger demand.
Keep media promotion and stock in the same review
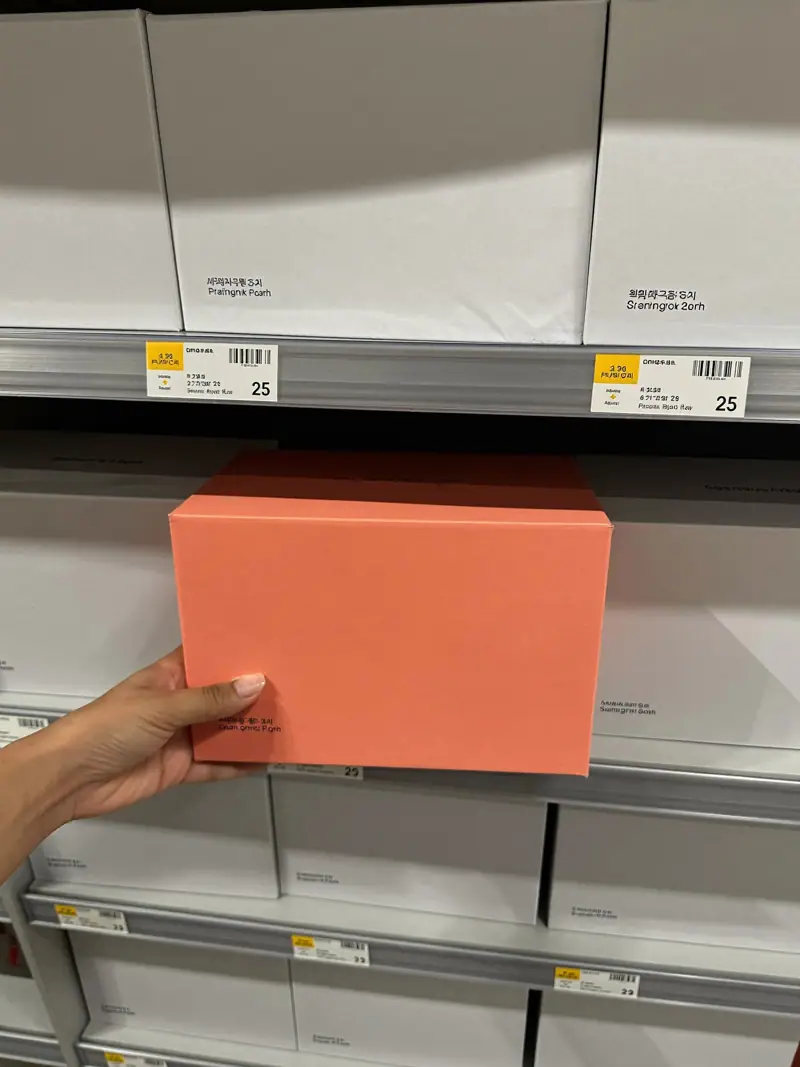
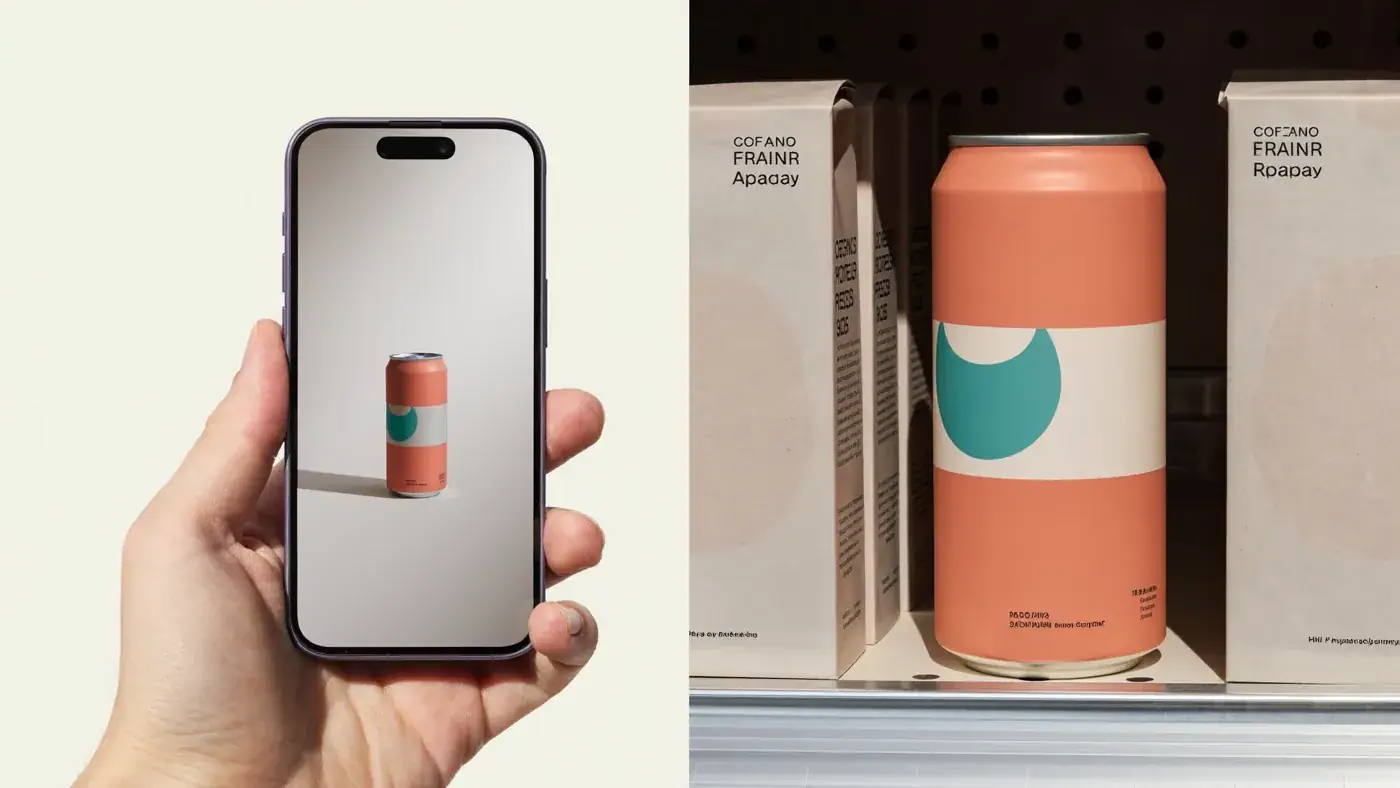
Before reviewing a campaign, record distribution changes, stockouts, retailer displays, price promotions and competitor activity. Use that context to decide what can be reasonably concluded. A region with both more advertising and wider distribution cannot isolate the ad’s effect through a simple before-and-after chart. An appropriate experiment or model can investigate contribution, with design and uncertainty disclosed. For packaging, test recognisability at the shelf and the ecommerce thumbnail, then assess whether the intended brand and variant are understood. Consumer interviews help explain confusion, but simulated choices are not actual sales. Keep creative diagnostics and commercial outcome evidence connected without giving either more certainty than it supports.
Brief the next campaign from the growth constraint
A brand with strong demand but frequent stockouts needs availability work alongside communication. A brand with broad distribution but weak recognition may need clearer distinctive assets and occasion cues. A brand dependent on deep discounting needs a careful view of price, repeat behaviour and contribution. Quiamo can help shape a shopper communication brief that combines packaging, campaign art direction and a defined measurement plan. Retail and finance colleagues should validate the market coverage and cost treatment. The first useful deliverable is a diagnosis of the constraint, followed by creative work that addresses it. More impressions are not automatically the answer to every slow-moving SKU.
Before interpreting the result
Ask the retail-data owner to explain the universe behind the distribution number. Does it represent all relevant outlets, a measured sample or a selected retail channel? Check the handling of a store that sells out halfway through the period. A product recorded as present at some point may still be unavailable when shoppers need it. For a velocity comparison, hold the SKU and unit basis steady and inspect the original stores separately from new distribution. Speak with retail teams about shelf position and replenishment rather than assuming a slow store has weak consumer demand. Those checks help decide whether the next brief should address visibility, occasion relevance or a commercial availability problem. Keep the distinction visible in the report so a packaging or campaign change is not asked to repair a distribution issue it cannot control.
Questions people ask
Is weighted distribution always better than numeric distribution?
They describe different things. Weighted distribution reflects store importance on the selected weighting basis; numeric distribution describes breadth. Use both and examine the commercial question rather than ranking one as universally superior.
Can we compare rate of sale across pack sizes?
Only with careful units and context. Packs, litres, kilograms and sales value give different views. State the chosen basis, price and channel so a larger or higher-priced pack is not compared misleadingly.
Does penetration growth prove advertising worked?
No. Penetration can change with distribution, price and other conditions. Advertising contribution requires suitable causal measurement or a clearly qualified observational analysis.
Can a stockout look like weak demand?
Yes. Recorded sales fall when shoppers cannot buy the product, even if demand remains strong. Add availability evidence and examine comparable stores over a consistent period. Do not ask a new campaign to repair an unrecognised replenishment problem. The response may require distribution work before additional media becomes commercially useful.
The next useful step
FMCG marketing metrics should show whether growth came from more buyers, easier availability or stronger sales where the product was already present. Bring Quiamo a defined category, distribution view and the packaging or campaign being reviewed. We can scope communication work around the growth constraint the evidence actually reveals. Discuss the communication brief with Quiamo.
Give the occasion a clearer brand cue
Share one SKU, its packaging and the buying occasion you need to win. We can scope packaging or campaign communication with a defined recognition and commercial-evidence plan. Remove personal and confidential information from any example you share.
Sources
- NielsenIQ distribution learningNumeric ACV and PCV weighted distribution definitions.
- NielsenIQ total distribution pointsDistribution breadth and depth across products.
- NielsenIQ velocity dictionaryVelocity as sales per distribution point.
Worked examples on this page are fictional and labelled. Search phrases and figures from external sources are cited; nothing here describes a Quiamo client result.